
TRIM function is used to remove the additional spaces (i.e. spaces before/after/between the words) except for single space between words.
These are the non-value added spaces and generally arises when data is imported from any other sources.
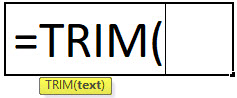
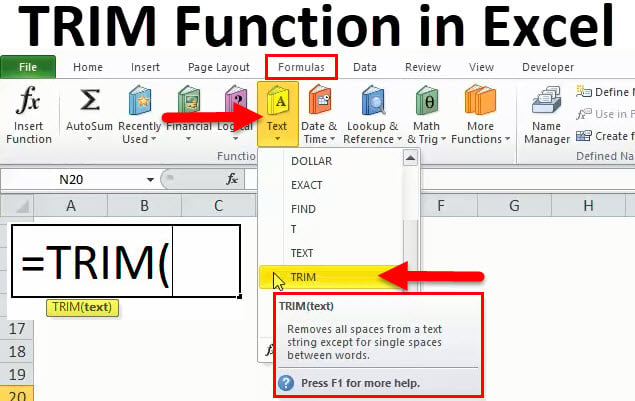
text argument [Required] is used to give the text or cell reference for which additional spaces to be removed
TRIM Function has only one “Required” arguments i.e. text
There is only one argument in the Trim function, which is below mention.
=Text(Cell Value / Text)
Here we have some examples, where “Column A” has various scenarios there is a problem of spaces. Words doesn’t have proper spacing it looks untidy and “Column B” shows the output of the function. Where formula of TRIM is applied and we can see after applying the formula extra spaces removes The explanation is also provided in Column “C”.
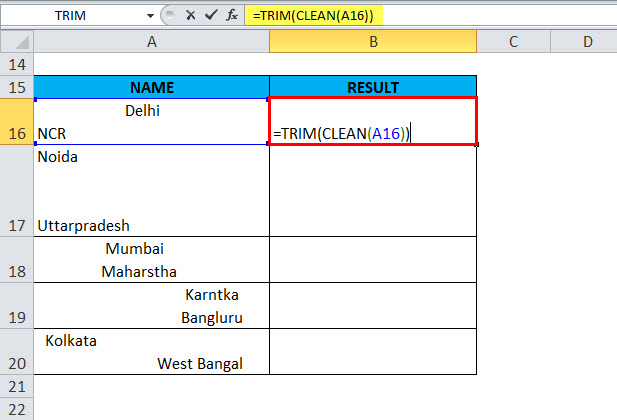
Generally when we collect data in excel from another application or any database like Server, Oracle, or HTML, we face various issues for line breaking with extra space; we can say that double line issue or wrap text issue, and also ever include with a special character which is not removed with only trim. So we can use a trim function with a clean function for such type situations. Example given below:-
In this type of scenario will use TRIM CLEAN Formula.
Formula =TRIM(CLEAN(A16))
With the help of the TRIM Clean formula, the data will be cleaned, removing all spaces, and correcting the positions of words.
TRIM function is very advantageous in many ways. It helps for the document imported from any other sources and data is not correctly synchronized.
Removing spaces in available strings manually (one by one) is very difficult. TRIM Function helps apply in large databases at once, makes the work easy, saves time, and increases efficiency.
TEXT function is used to change the formatting or appearances of the text. There are various types of formatting available.

UPPER function is used for changing the text/string to UPPER case in Microsoft Excel. The output of the function returns value in new cell.
You must have faced a condition when your data cells contain extra spaces, leading spaces or trailing spaces and you wanted to remove these extra spaces to standardize the data. So here you may use…

Microsoft Excel “NOW” function is used to get the current Date and Time. It is very useful function and can be used in many ways.
Excel Function ISERROR Microsoft Excel “ISERROR Function” is a Logical Function and it is used to check if cell contains any “ERROR”. “ISERROR Function” is used as a test to validate if cell contains any…
WORKDAY Function in Excel Are you working today? or Do you have Work Off or holiday today? I am asking this question because I am gonna tell you the most commonly used function in Excel…