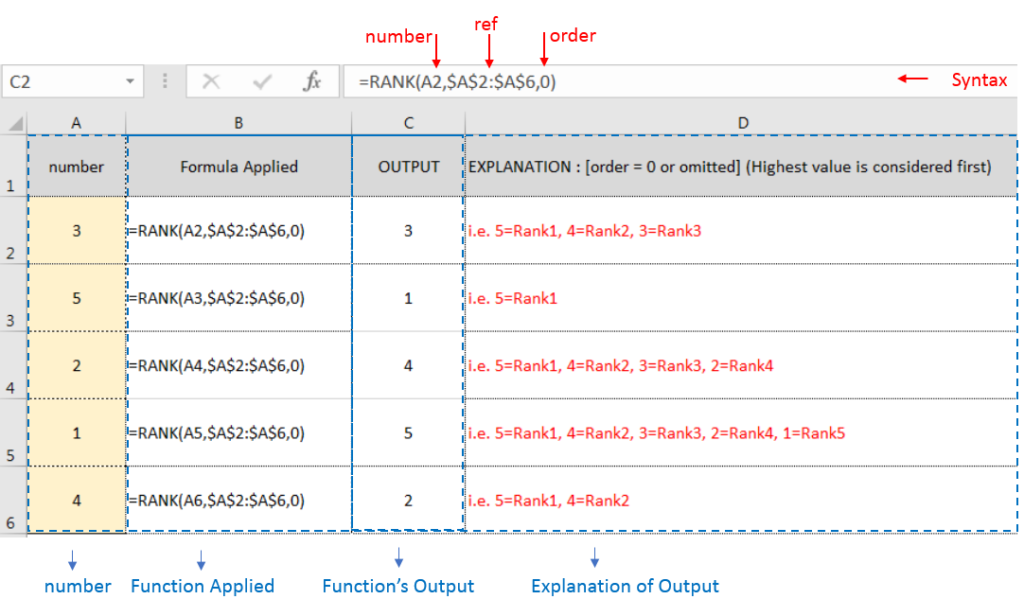
RANK function performs the Ranking in a range or list of numbers. Function returns the rank position and can assigned as Highest or Lowest value as 1st rank as per order argument.
Syntax:
=RANK(number,ref,[order])
number argument is used to give number value for which ranking is required
ref argument is used to give range or list of values from which rank to measure
[order] is optional argument and Value 0 or 1 can be given as per below requirements:
[order] = 0 or omitted: Highest value will be Ranked as 1st position (example: Value 5=Rank1, 4=Rank2, 3=Rank3, 2=Rank4, 1=Rank5 and so on)
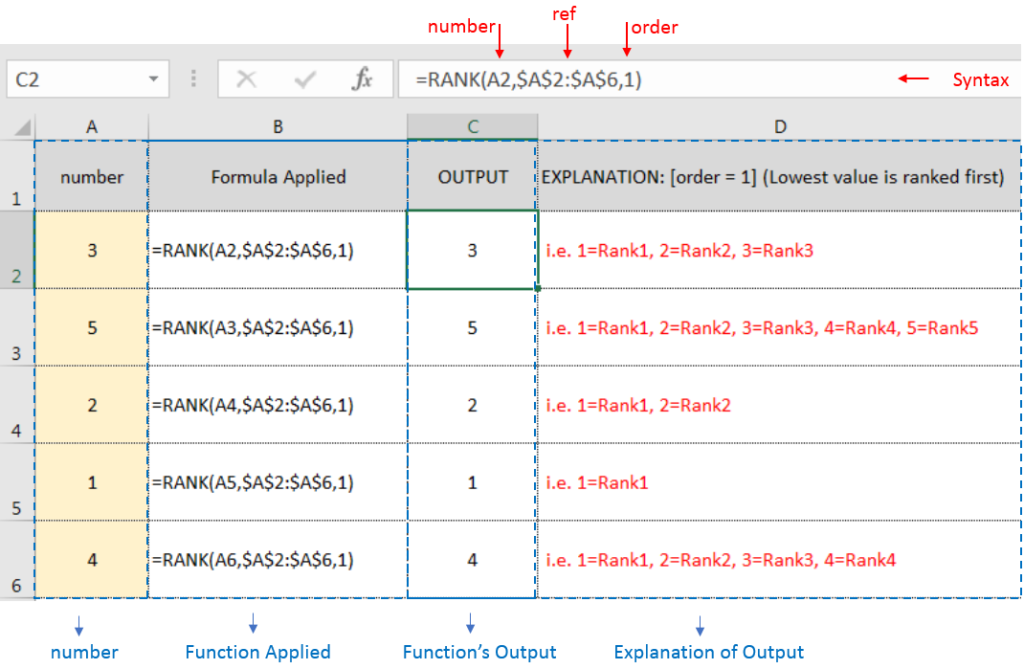
[order] = 1: Lowest value will be Ranked as 1st position (example: Value 1=Rank1, 2=Rank2, 3=Rank3, 4=Rank4, 5=Rank5 and so on)

Example 2: RANK function with [order = 1] (Lowest value is ranked first)

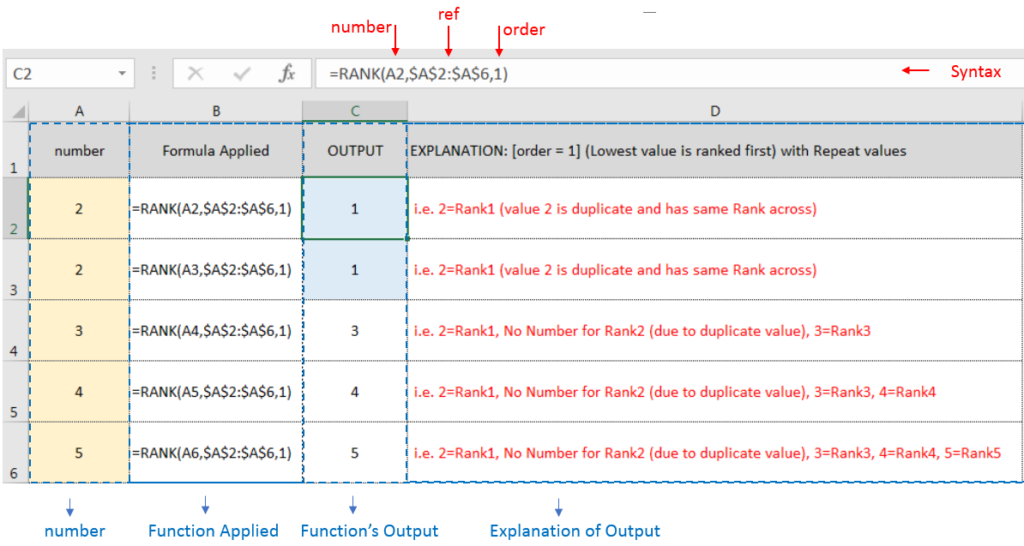
Example 3: RANK function with [order = 1] (Lowest value is ranked first) with Repeat values

If list of values or ref argument has duplicate values, ranking for those values will be same across
Hope you learnt this Function,
Don’t forget to leave your valuable comments!
If you liked this article and want to learn more similar tricks, please Subscribe us or follow us on Social Media by clicking below buttons:

Conditional Formatting helps to easily identify the usual and unusual numbers/ conditions, creating interactive visualization by means of Highlight Cells by Rules, Top/Bottom Rules, Data Bars, Color Scales and Icon Sets.

This tutorial explains how the TRANSPOSE function works and shows you the right way to use it to switch data in Excel.
Everyone has different preferences, even for work habits. Some people like to arrange data in vertical columns, while others prefer horizontal rows. If you ever need to switch the direction of your data quickly, the TRANSPOSE function can help

Blank rows in Excel can be a real hassle, making it harder to move around and work with your data. But don’t worry—there are plenty of easy ways to get rid of these unwanted rows….

Microsoft Excel “DAY, MONTH, YEAR Functions” are date related functions helps to extract the Day, Month or Year from a Date.

How to Create a Pivot Table? Pivot Tables in excel is backbone of data analysis in excel. If you want to perform various analysis in excel, then I would suggest, learn this amazing excel feature…

Introduction Calculate Percentage in Excel :-The term “per cent” comes from the Latin per centum, meaning “by the hundred.” A percentage is a way to show a part of something out of 100. You can…