Pivot Tables in excel is backbone of data analysis in excel. If you want to perform various analysis in excel, then I would suggest, learn this amazing excel feature to complete your analysis with in few minutes
Its name is enough to make you feel worried however; usage of Pivot Table is relatively simple. You would enjoy while learning Pivot Table with us.
We would take a simple example and detailed steps including the basics of Pivot Table to make you understand better so that, you can use Pivot Table efficiently
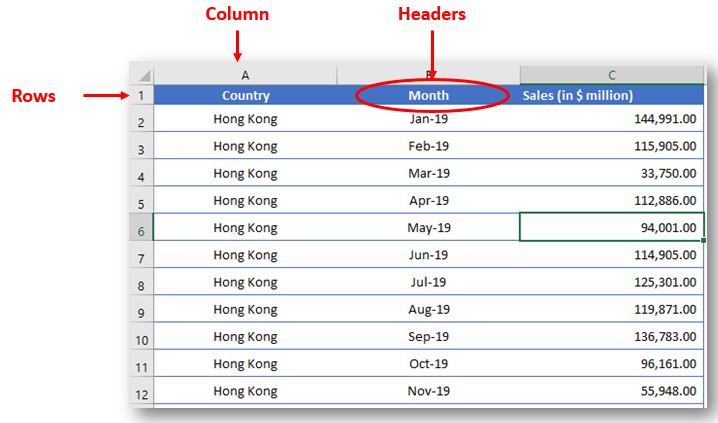
Pivot Table helps to summarize the data by grouping data in rows or columns to provide the consolidated results even for large database. This helps to read the data in few seconds and get insight of it
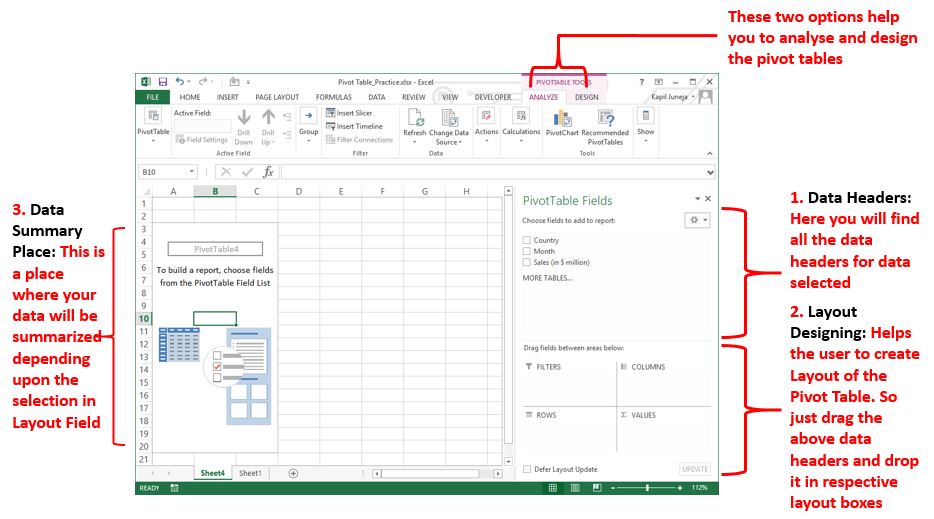
Preparation of PivotTable requires a VALID database and below is the requirement of Database:
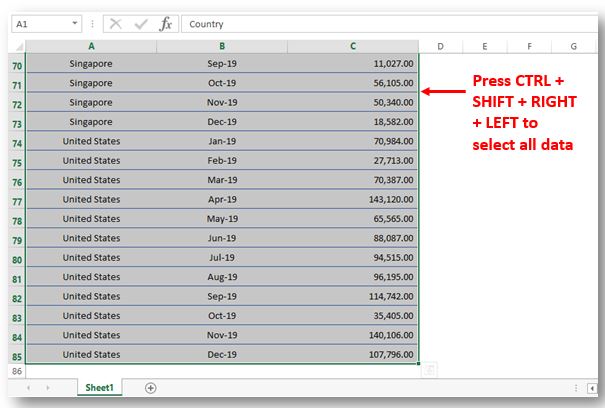
Imagine you are the owner of a company and has global presence with branch offices in multiple countries. Company has sales figures for various regions and for different periods. Your boss asks you to summarize the data and answer below questions:
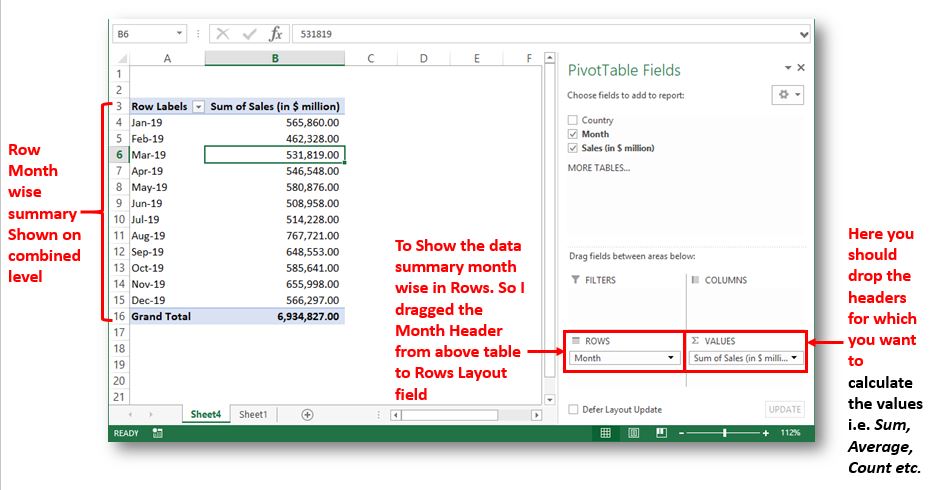
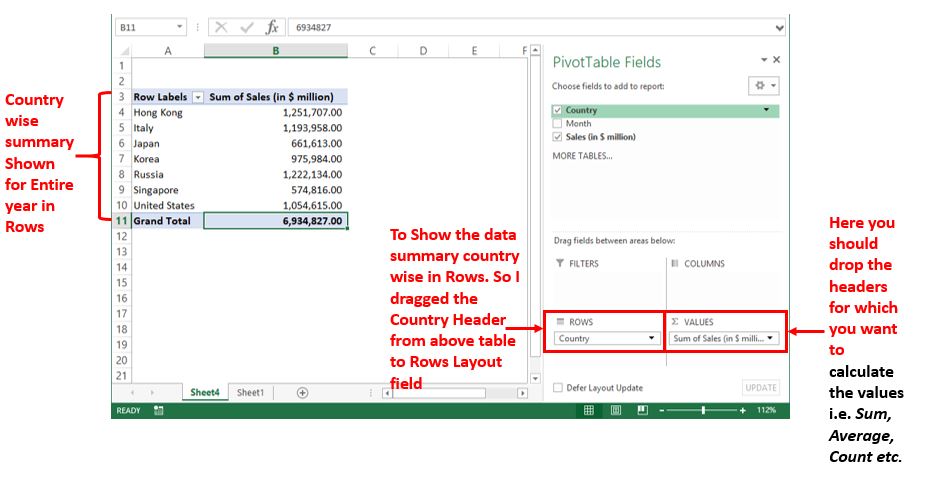
You can answer these questions in few seconds by creating pivot tables.
Hope this article helped you to create your first pivot table. You may download the practice sheet from below icon. Please comment if you have any questions or facing any challenge.
Are you enjoying learning excel with us? Subscribe Now for more updates
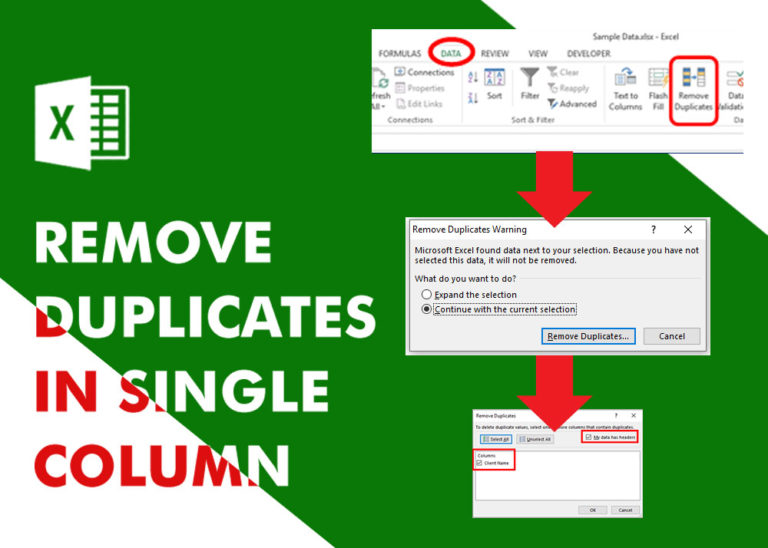
Remove Duplicates in Excel Highlight/Select the Column A, similar to shown in below screenshot: Go To “Data” tab on Menu Bar and click on “Remove Duplicates” as shown below: Once you click on “Remove Duplicates”,…
While starting Excelsirji.Com, it is always been critical for me to find the best to amaze the viewer experience. So I spent many hours on web to read, explore amazing excel content which I really…
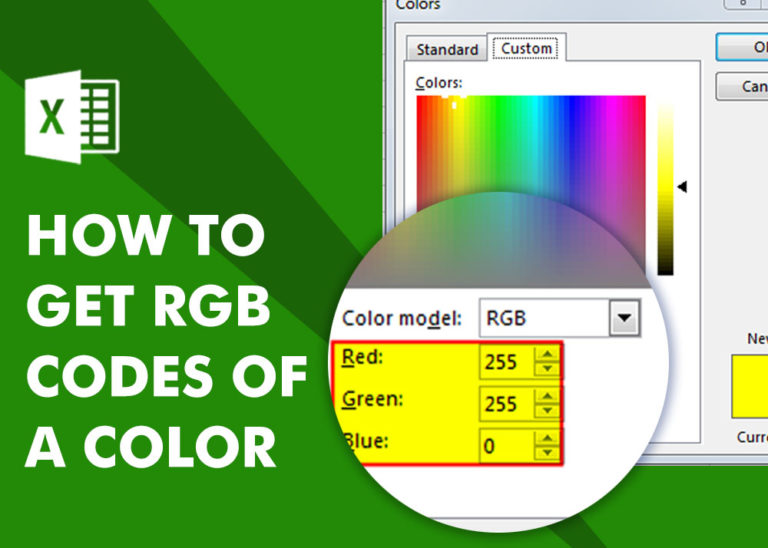
How to Get RGB Codes of a Color? Excel supports more than 16 million colors in a cell; hence you should know how to set the exact color in a cell. To do this through…
Excel Dark mode reduces eye strain and makes the screen more comfortable to work on in high-contrast settings. Follow this easy tutorial to enable dark mode for both the Excel interface and the spreadsheet cells.
Understand the basic Different between Excel Online vs Excel Desktop. Excel Online is like a simpler version of Excel that you can use in your web browser. It has most of the important features you need, but it doesn’t have advanced things like macros. This article dives into the differences between Excel Online and the excel Desktop version to help you understand what each one is good at and where they fall short.
How to Compare TWO Columns in Excel? Comparing Columns in Microsoft excel is much often feature that is used while managing database. We have many ways to compare the columns in excel and can be…