LOWER function is used for changing the format of any text or string to LOWER Case.
LOWER Function has argument only one argument i.e. text, which makes the function easy to apply and understand. We need to give the cell reference or value of string in the text argument.
=LOWER(text)
text argument, is used to give the cell reference of the string or value that needs to be changed to Lower Case
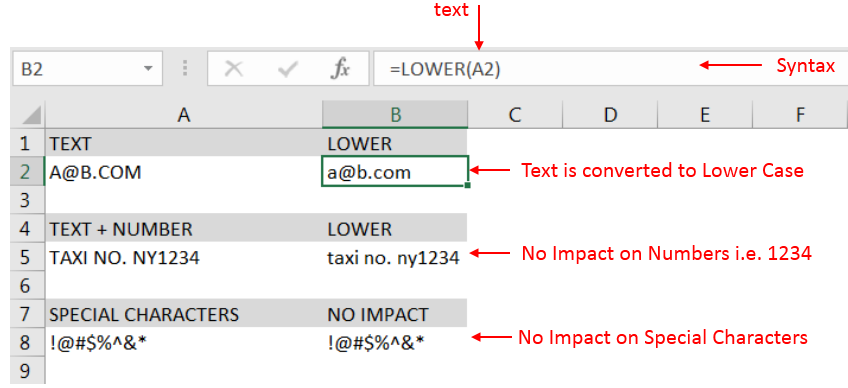
Here we have some examples where in “Column A” various type of strings are available and are required to be changed to “LOWER CASE”. Output of the function returns value in ”Column B” and explanation is also provided.
text argument, “A2” is the cell reference for text that is to be changed to “LOWER CASE”

– Output in Cell “B2” is showing that the string is changed to Lower Case.
– Output in Cell “B5” is including text and number and no impact in “Numbers” are shown.
– Output in Cell “B8” has only Special Characters and there is no impact of “LOWER Case” function.
– Number/ Punctuation/ Space/ Special Characters will not have any impact of Function
– If cell reference is not correctly provided in the function, then it will give output as “#VALUE!” (Error)
– Function should give output in “General” format, however if output is not as per the desired format then we need to change the cell format to “GENERAL”
Hope you learnt this Function,
Don’t forget to leave your valuable comments!
If you liked this article and want to learn more similar tricks, please Subscribe to us.

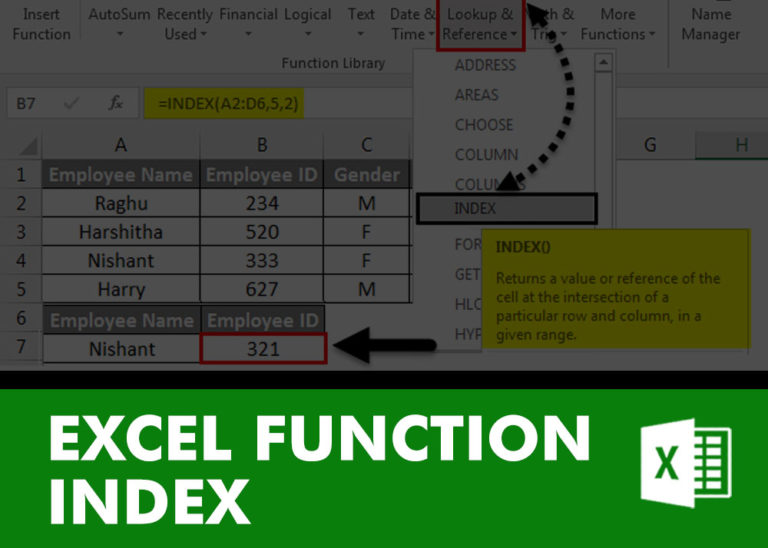
INDEX function is used to get the value from a cell range or table, function returns the value from a table where row and column intersect with each other.

MID function is used for extracting the mid characters from the available string. The output of the function returns the extracted characters in new cell.

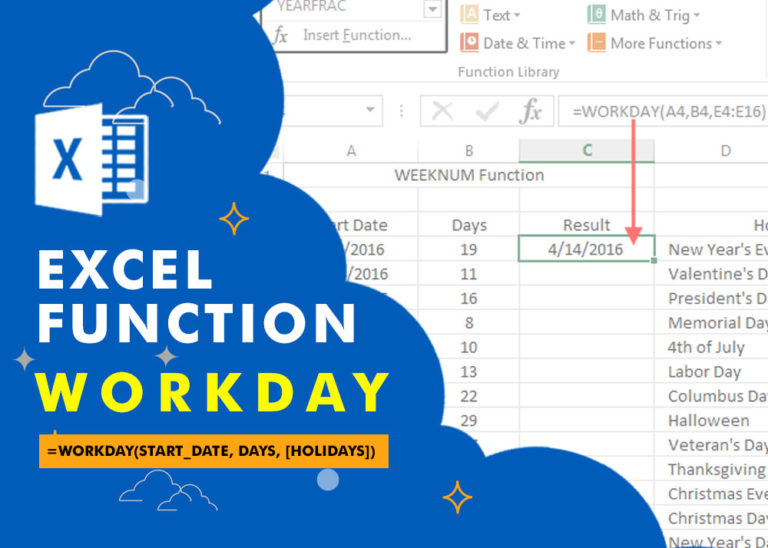
WORKDAY Function in Excel Are you working today? or Do you have Work Off or holiday today? I am asking this question because I am gonna tell you the most commonly used function in Excel…

Excel Function COUNTIF COUNTIF Excel Function is also one of the most used function in excel. This helps the user to calculate the number of counts based on single logic given by the user. You…

Working with huge data is always exciting and challenging. From 2007 version onward, Excel is supporting more than a million rows in each worksheet. One of the common problems with huge data is “Duplicates” and the bigger problem is to identify and remove these duplicates. In this article, we will be sharing 4 ways to delete duplicate records from your data.

Microsoft Excel “TODAY” function is used to get the current Date. It is very useful function and can be used in many ways. “TODAY Function” does not have any argument that makes this easy to apply and implement.