Microsoft Excel is a popular spreadsheet application widely used for data analysis and management. One of the essential skills for working with filter data in Power Query in Excel. Filtering allows you to focus on specific subsets of your data, making it easier to analyze trends and identify patterns.
While Excel offers basic filtering options, Power Query provides a more robust and flexible way to filter data. Power Query, also known as Get & Transform (in older Excel versions), is a built-in data manipulation tool that empowers you to perform advanced filtering and cleaning tasks on your data.
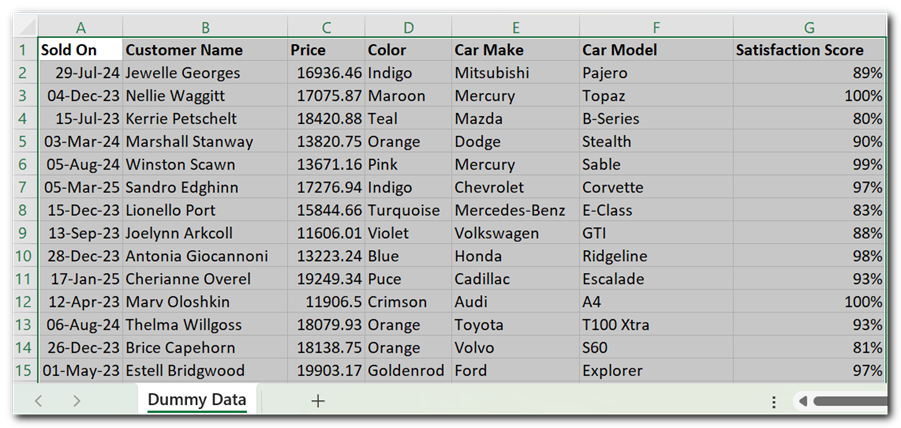
Select the data range on which you want to apply filter using Power Query.
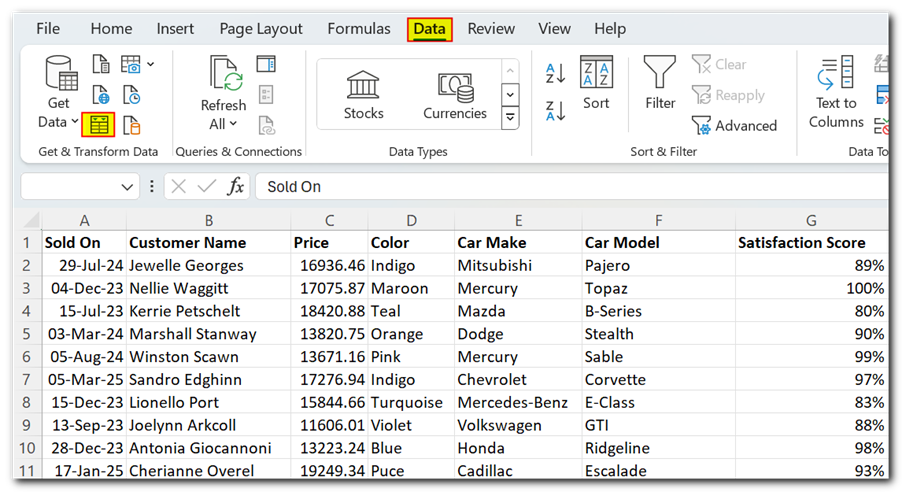
Go to the Data tab on the ribbon and click on From Table/Range. If the selected data is not a table then Power Query will automatically convert the data into a table.
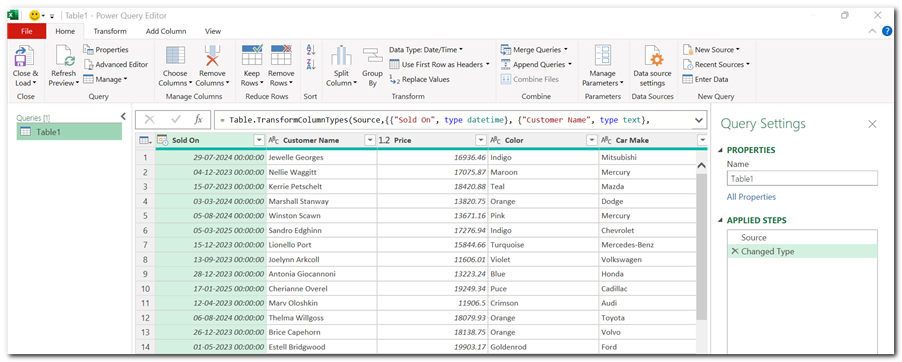
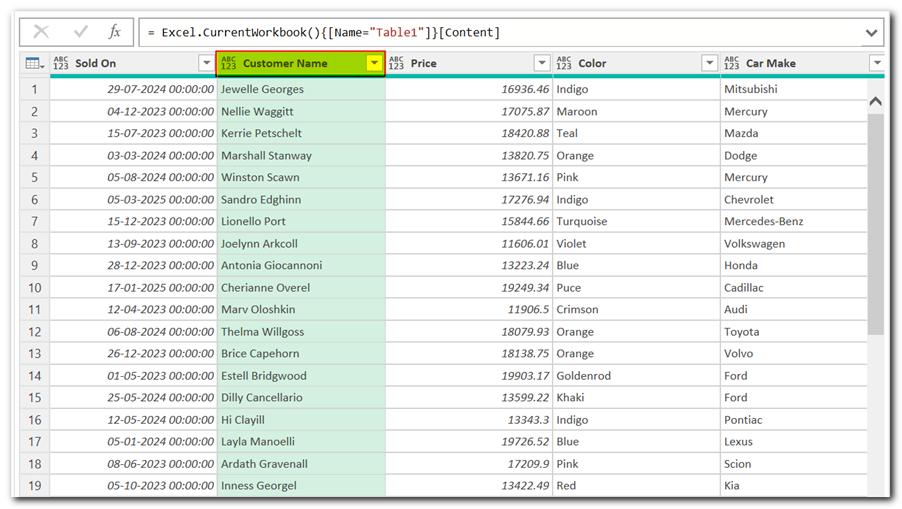
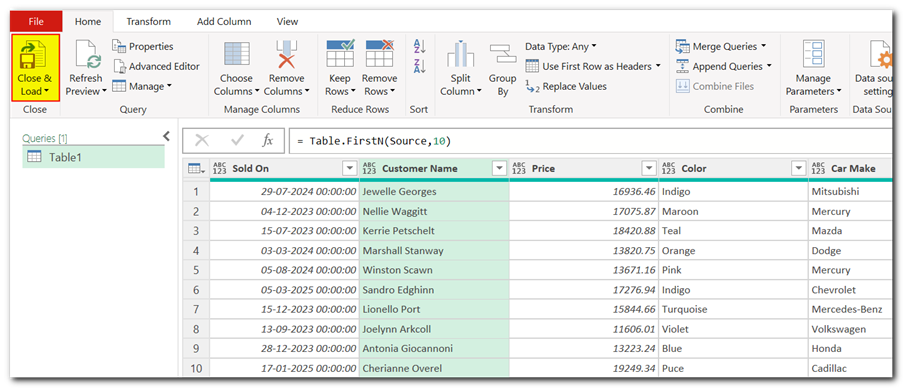
Power Query Editor will launch, displaying your data.
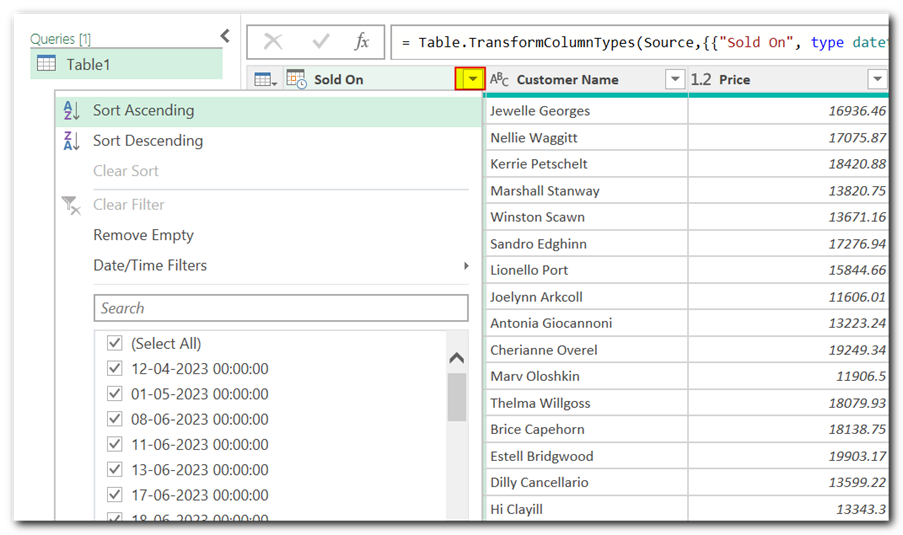
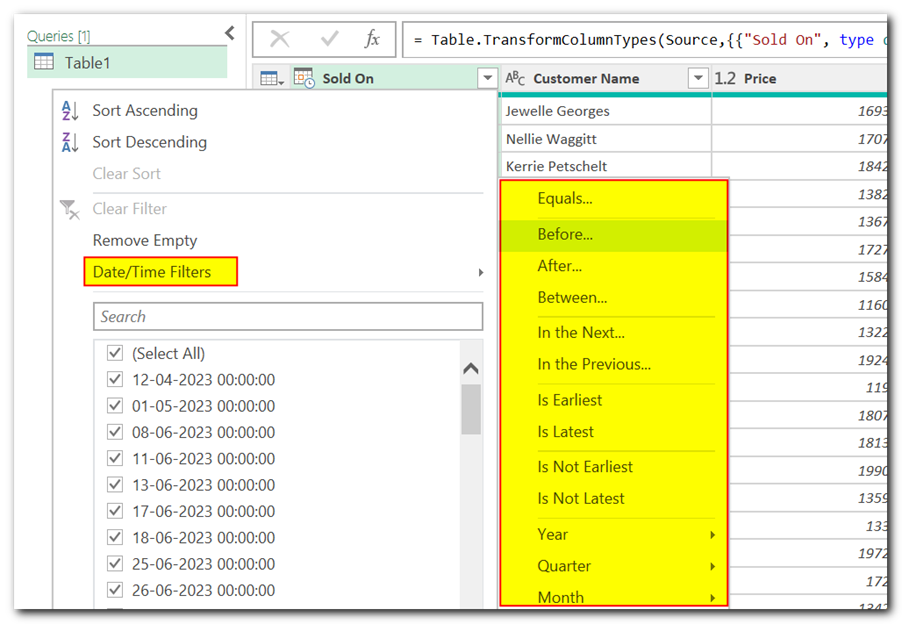
Click the down arrow in the header of the date/time column you want to filter.
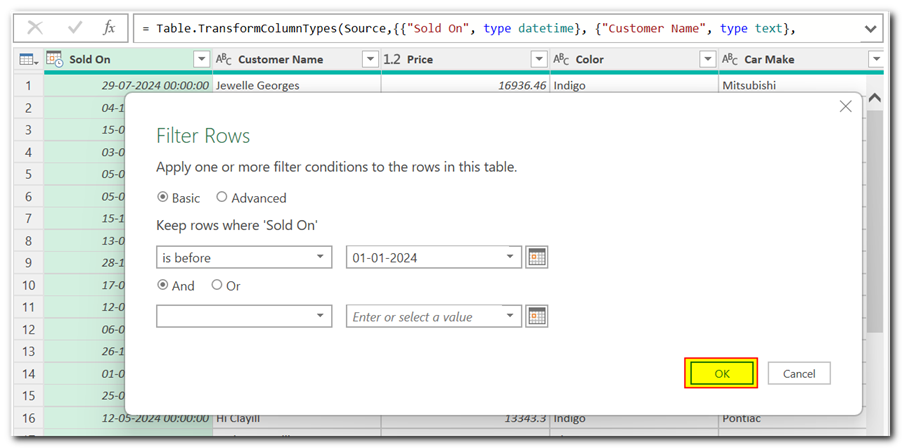
You’ll see various filter options based on your data type. Use options like Equals, Before, After, or Between to filter by specific dates or date ranges.
Click OK to apply the filter.
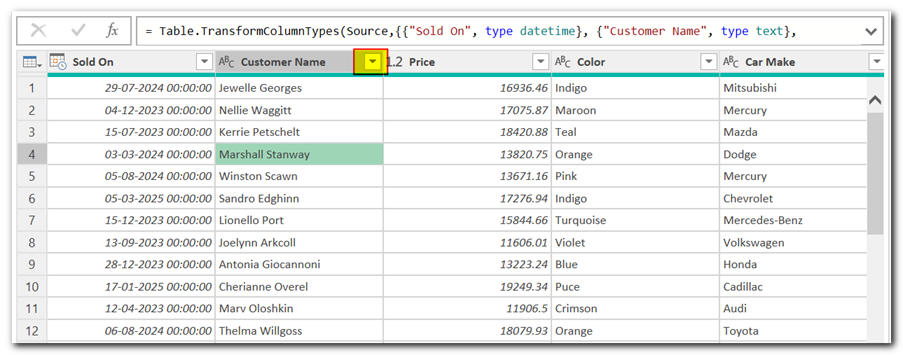
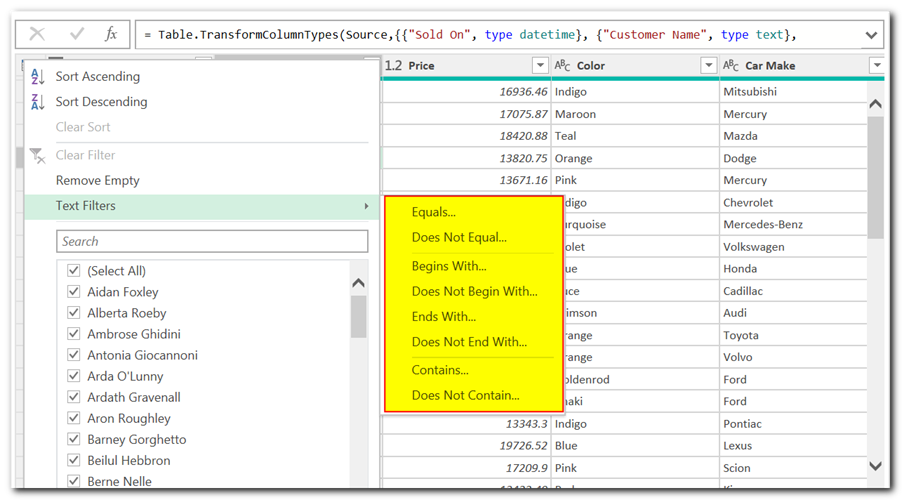
Click the down arrow in the header of the text column you want to filter.
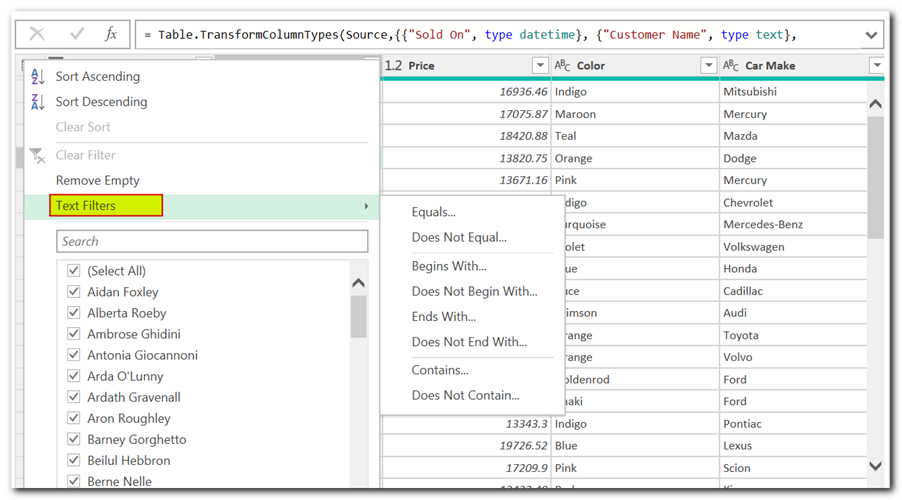
Choose Text filters.
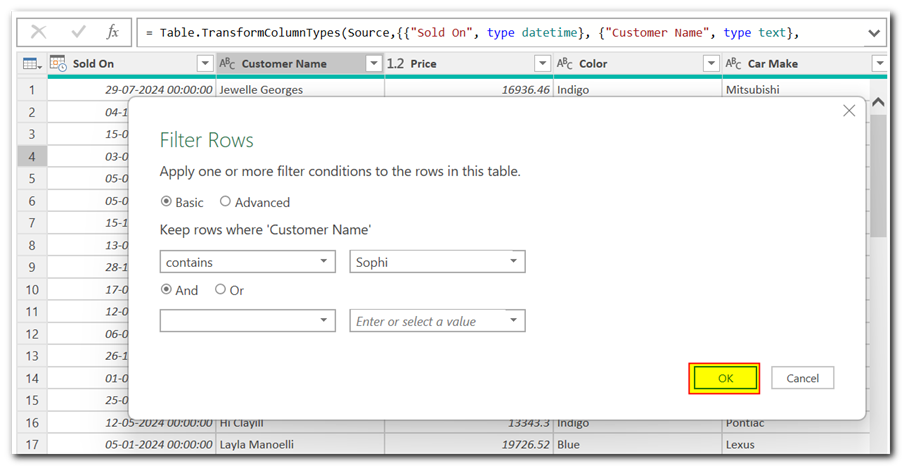
Utilize options like Contains, Does Not Contain, Begins With, or Ends With to filter based on text patterns.
Enter the desired text criteria and click OK to apply the filter.
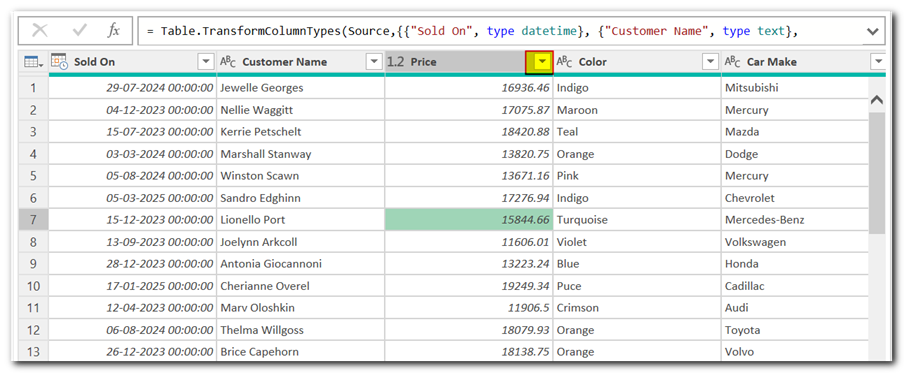
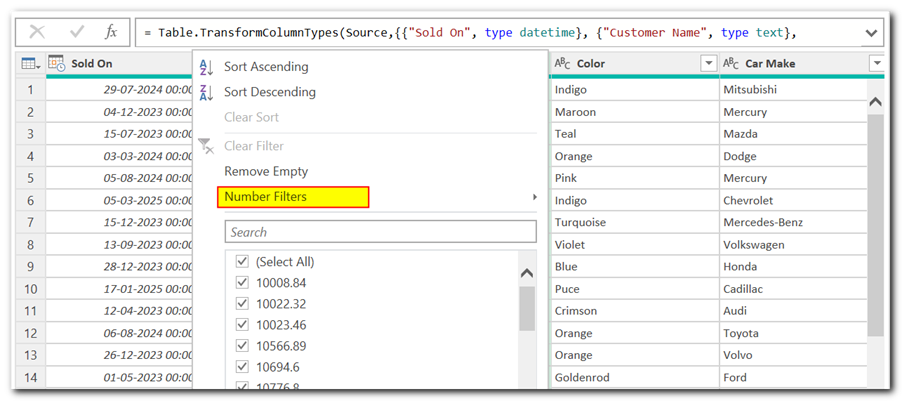
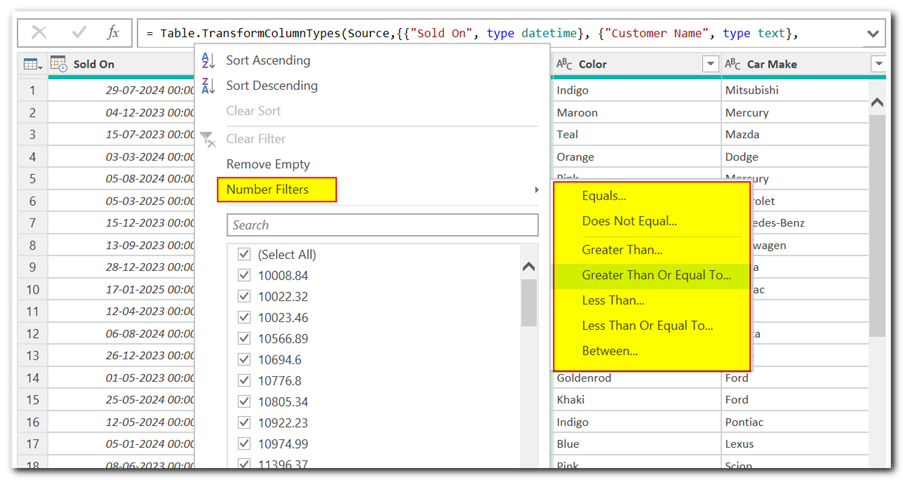
Click the down arrow in the header of the number column you want to filter.
Select Number Filters.
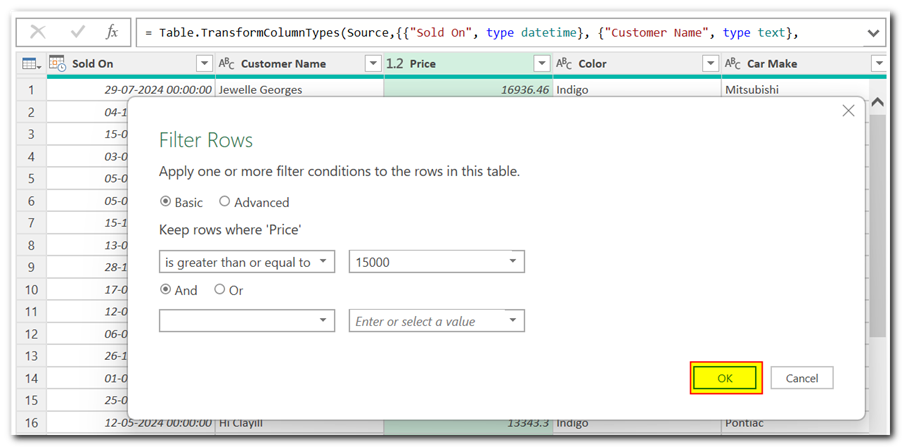
Choose options like Equals, Greater Than, Less Than, or Between to filter based on numerical values.
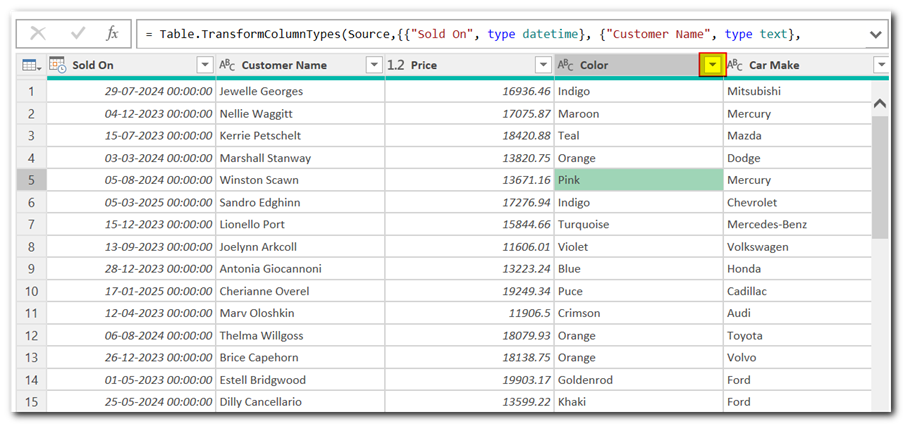
Enter the desired numbers and click OK to apply the filter.
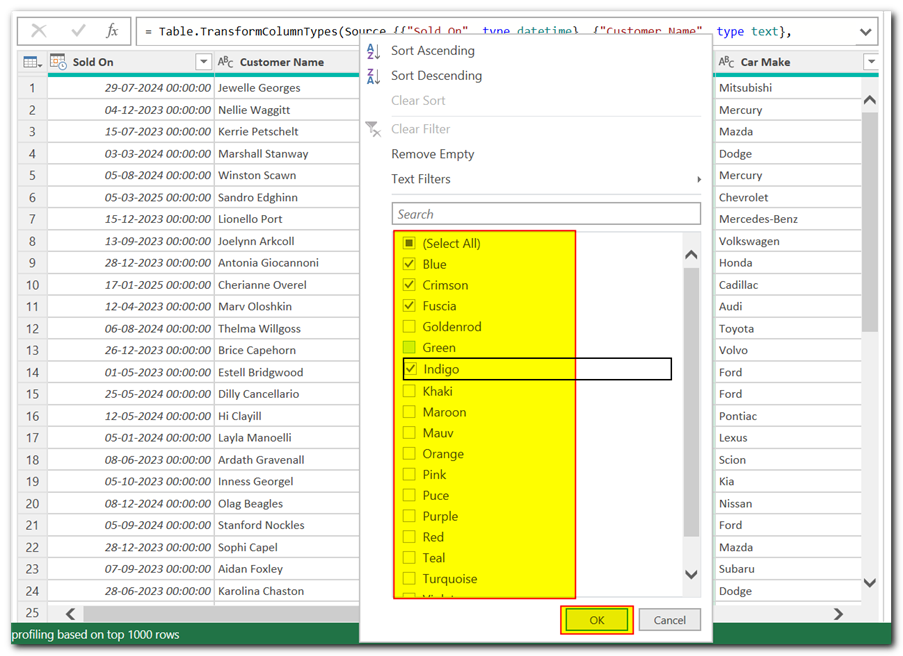
For columns with a limited number of unique values (e.g., color column), click the down arrow in the header.
You’ll see a list of all unique values. Simply check or uncheck the boxes next to the values you want to include/exclude in your filtered data.
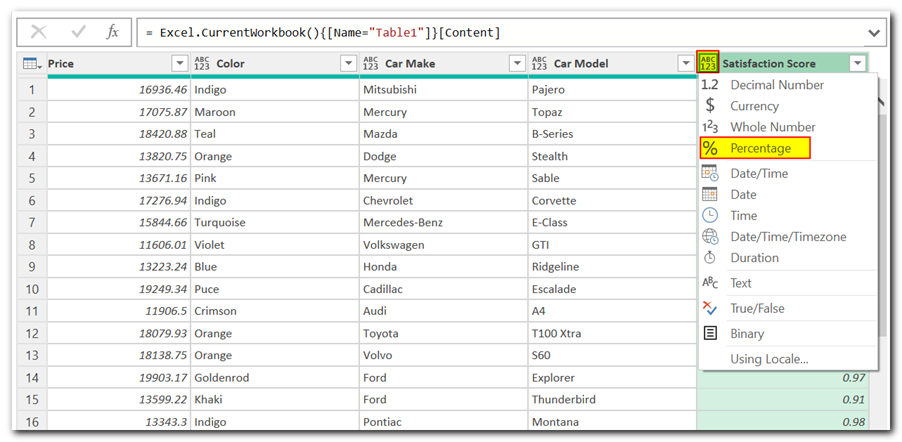
If your percentage data is imported as a decimal, click on the data type name and choose Percentage.
Then, follow the steps for filtering numbers as mentioned earlier.
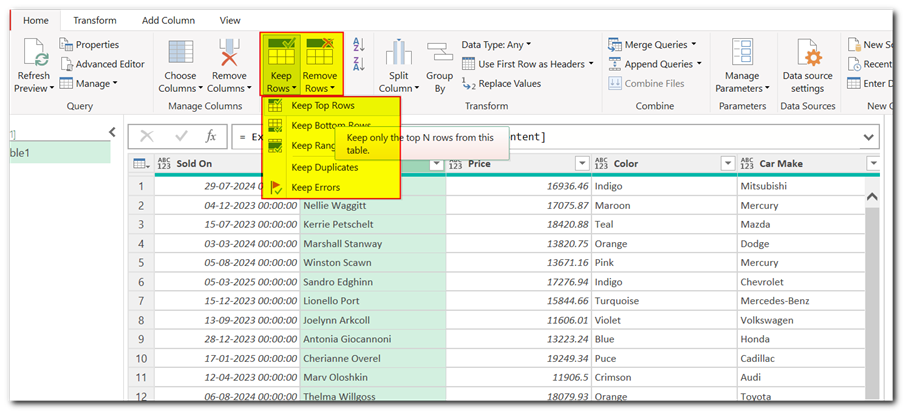
Select the column you want to use for filtering by rows.
Click on Keep Rows or Remove Rows under the Home tab in Power Query Editor.
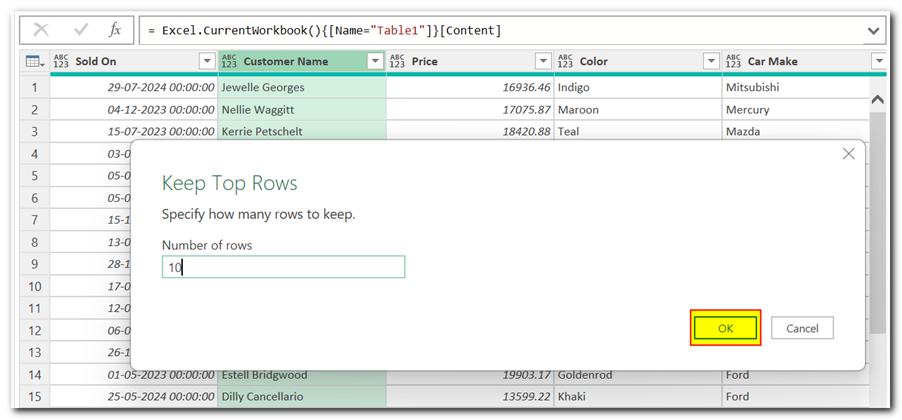
Choose options like Top Rows, Bottom Rows, or Range to specify which rows to keep or remove.
Once you’re satisfied with your filtering, click Close & Load.
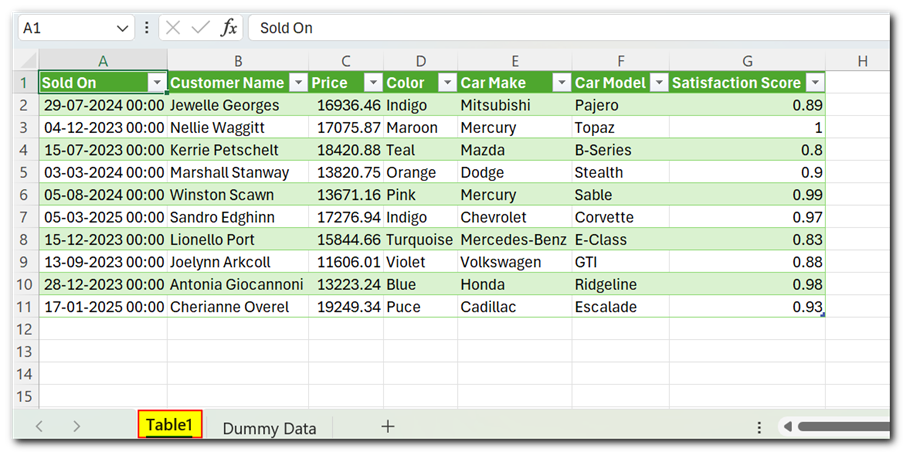
Power Query will create a new sheet in the Excel containing the filtered data.
By mastering Power Query’s filtering capabilities, you can significantly enhance your data analysis workflow in Excel. This guide has equipped you with the essential steps to filter data by dates, text, numbers, and more. With practice, you’ll be able to leverage Power Query for complex filtering tasks, transforming your raw data into valuable insights.

This Excel VBA Code converts the excel range into HTML and also can convert Excel to HTML Table to paste data on Outlook Email Body

How to use VBA to open Workbook in Excel? There are few VBA codes which are commonly used by every developer. One of them is giving an option to user to browse a file. Below is a…

This Excel VBA Code helps to Get User Name. Here is an example environ(username) or Application.username.This macro gets the username from active directory.

What is Excel Tables? Excel tables organize data into rows and columns with special features like unique names for columns, easy-to-use formulas, automatic formatting, and simple sorting and filtering. They make data management and analysis…

Introduction In this article, we will learn about joining multiple excel tables with Power Query. Consider a situation where you have employee data in two sheets of an Excel file. In the first sheet you…

Here is one more wonderful free tool from ExcelSirJi.com which makes your life easy. Time & Motion Tracker helps you to track Start and End time of any type of transaction or activity. The good thing is, it is VBA based tool which helps you to protect from manual manipulation in the data by the user. It is also easy to use, just click on Start (shortcut: Ctrl+Shift+A) or Stop (Ctrl+Shft+S) buttons to record the time