Linear regression analysis in Excel
Understanding how different factors influence outcomes is key to making informed business decisions. One of the simplest yet most effective techniques for this is regression analysis—and Excel makes it surprisingly easy to perform, even without coding skills. Whether you’re a sales analyst, a marketing manager, or a student learning statistics, mastering regression analysis in Excel can open the door to better forecasting and data-driven insights.
Table of Contents
What is Regression Analysis?
Regression analysis is a statistical method used to examine the relationship between two or more variables:
- The independent variable (X) is the factor you believe influences the outcome.
- The dependent variable (Y) is the outcome you’re trying to predict or explain.
For example:
- How does advertising spend affect sales?
- How does study time impact exam scores?
- How does temperature influence ice cream sales?
The most common type of regression analysis is simple linear regression, where this relationship is represented using a straight line (best-fit line). The equation of this line can then be used to make predictions.
Why Use Regression Analysis in Excel?
Excel is widely accessible and ideal for beginner to intermediate data analysis. Benefits include:
- No coding required—ideal for non-technical users.
- Built-in formulas like SLOPE, INTERCEPT, and RSQ for quick manual analysis.
- Data Analysis Toolpak for detailed regression reports.
- Chart-based trendlines for visual learners.
- Forecasting abilities using simple linear equations.
Whether for business analysis, academic projects, or personal data tracking, Excel’s regression analysis features are flexible and user-friendly.
Sample Data for Practice
Imagine you’re evaluating how advertising spend affects monthly sales:
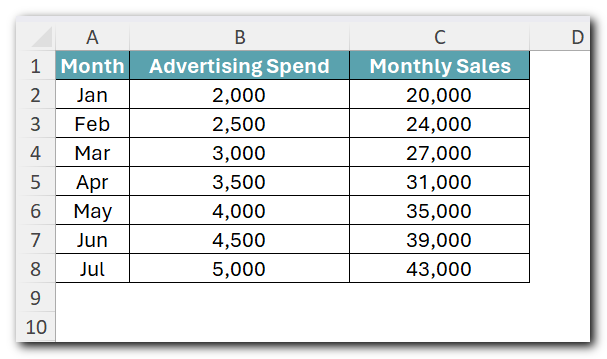
Here:
- X (Independent Variable): Advertising Spend
- Y (Dependent Variable): Monthly Sales
Your goal is to quantify how much sales increase with every additional dollar spent on advertising.
How to Perform Regression Analysis in Excel (3 Methods)
Method 1: Using Chart Trendline (Quick Visual Approach)
Ideal for quick insights and simple visualization.
Steps:
- Select your data(Advertising Spend and Monthly Sales) andGo to Insert → Charts → Scatter Chart.

2. Click on any data point in the chart → Choose Add Trendline.

3. In Format Trendline, select:
- Linear Trendline.
- Check Display Equation on chart.
- Check Display R-squared value on chart.


Results:
- Regression equation displayed as y = mx + c.
- R² value indicating the goodness of fit (closer to 1 is better).
Use this method when:
- You need a quick overview.
- Visual presentation matters.
- You’re explaining trends to non-technical stakeholders.
Method 2: Using Data Analysis Toolpak (Detailed Statistical Output)
For serious analysis, Excel’s built-in Data Analysis Toolpak provides a full statistical report.
Steps:
- Enable Toolpak:
- Go to File → Options → Add-ins.
- In Manage, select Excel Add-ins.
- Tick Analysis ToolPak and click OK.

2. Run Regression:
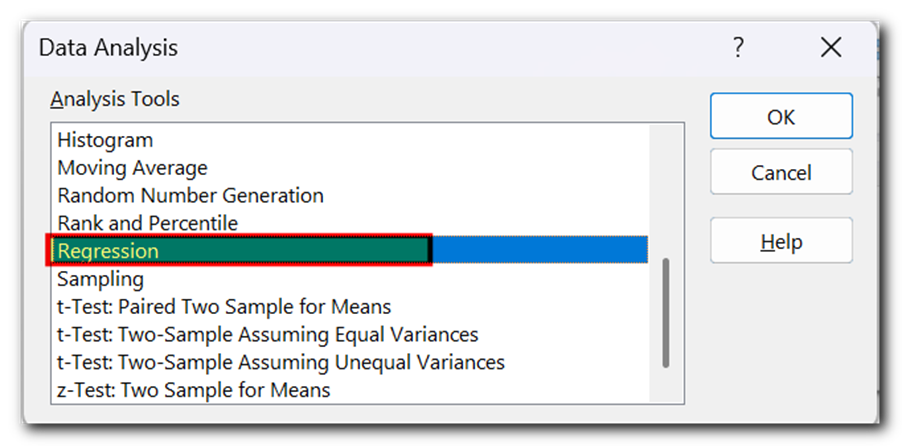
- Go to the Data tab and click on Data Analysis.
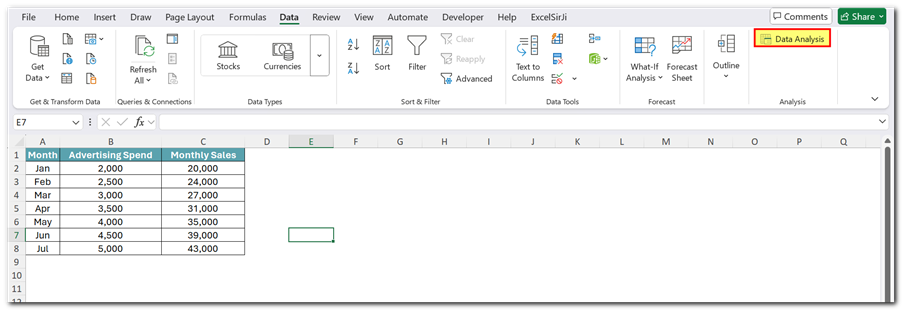
- Select Regression and click OK.
3. Configure Inputs:
- Input Y Range: Select Monthly Sales (dependent variable).
- Input X Range: Select Advertising Spend (independent variable).
- Check Labels if you have headers.
- Choose where to display output (new worksheet or specific range).

4. Analyze Output:
- Regression Statistics:
- R Square shows the strength of the model.
- Adjusted R Square adjusts for the number of predictors.
- ANOVA Table checks overall model significance.
- Coefficients Table:
- Intercept (constant term).
- X Variable 1 (slope of the regression line).
- Regression Statistics:

Example Regression Equation:
If the output shows:
- Intercept = 10,000
- X Variable 1 (slope) = 7
Your formula becomes:
Sales = 10,000 + 7 × Advertising Spend
This means for every extra $1 spent on advertising, sales increase by $7.
Method 3: Using Excel Formulas (Manual Calculation)
If you prefer using formulas, Excel offers built-in functions for regression analysis:
Function | Example Formula | Purpose |
SLOPE | =SLOPE(C2:C8,B2:B8) | Returns slope (m) of the line. |
INTERCEPT | =INTERCEPT(C2:C8,B2:B8) | Returns intercept (c). |
RSQ | =RSQ(C2:C8,B2:B8) | Returns R² value. |
FORECAST.LINEAR | =FORECAST.LINEAR(6000,C2:C8,B2:B8) | Predicts future Y from X value. |

Why use formulas?
- Build dynamic reports.
- Make real-time predictions as data updates.
- Avoid using charts or Toolpak for smaller tasks.
Frequently Asked Questions (FAQ)
R² (R-squared) measures how well your data fits the regression line:
- Closer to 1 = Strong relationship.
- Closer to 0 = Weak relationship.
An R² of 0.95 means 95% of the variation in the dependent variable is explained by the independent variable.
Yes. In the Data Analysis Toolpak, you can select multiple columns as the Input X Range to include multiple independent variables. Excel will automatically calculate coefficients for each variable.
Yes, regression analysis can be done in:
- Microsoft Excel 2013, 2016, 2019, 2021
- Excel for Microsoft 365
All these support:
- Chart Trendline
- Data Analysis Toolpak
- Formulas like SLOPE, INTERCEPT, and RSQ
For basic nonlinear regression, you can:
- Use polynomial trendlines (from the chart options).
- Use Solver Add-in for more advanced models.
However, for more complex nonlinear models, tools like R, Python, or SPSS are recommended.
Once you’ve derived your regression equation (from either the chart or Toolpak):
- Substitute the new X value to calculate Y manually.
- Or, use =FORECAST.LINEAR() to automate predictions directly in your spreadsheet.
Final Thoughts
Performing regression analysis in Excel equips you with a powerful tool to understand relationships, predict outcomes, and make informed decisions. Whether you’re visually exploring data with trendlines, generating detailed regression reports, or forecasting using built-in formulas, Excel provides everything needed for effective data analysis.
With no need for coding skills, Excel allows professionals across industries to leverage regression analysis for sales projections, marketing evaluations, academic research, and more.