While starting Excelsirji.Com, it is always been critical for me to find the best to amaze the viewer experience. So I spent many hours on web to read, explore amazing excel content which I really found helpful to grow as a perfect data analyst. I started learning new things and writing more about these articles which I am going to publish over the time of period
Here are some best excel resources for 2020 which we recommend. These can make you awesome in Excel and Data Analytics
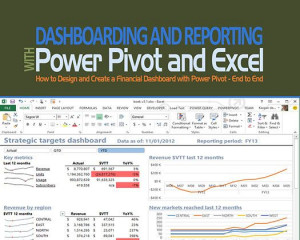
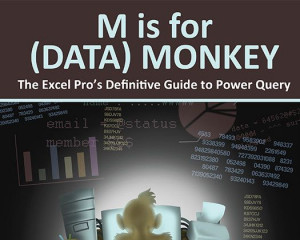
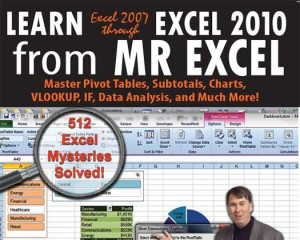
I really some excel books amazing which are easy for any new user to learn about Excel, Power Pivot, Dashboard making tricks. If you are thinking to learn Excel in real sense, you should read these books
You may also explore other awesome excel books which can really help you to become awesome data expert. Click here to know more
Here are Top Excel Blogs which you can refer for ultimate learning and new tricks for Advanced Excel, Data Analytics and many more or you may click here to find “Top 50 Excel Blogs for 2019“
We will keep updating this page with more interesting excel resources which you may like and find worthreading.
Have a great day 🙂
To subtract numbers in Excel, follow these steps:
Start by typing an equal sign (=) in the cell where you want the result.
Enter the first number or cell reference you want to subtract from.
Type a minus sign (-).
Enter the second number or cell reference you want to subtract.

How to Hide Ribbon &Formula bar in excel? While preparing many projects, my clients always want me to make professional, good looking dashboards. So I hide few things like Gridlines, Column & Row headings and…
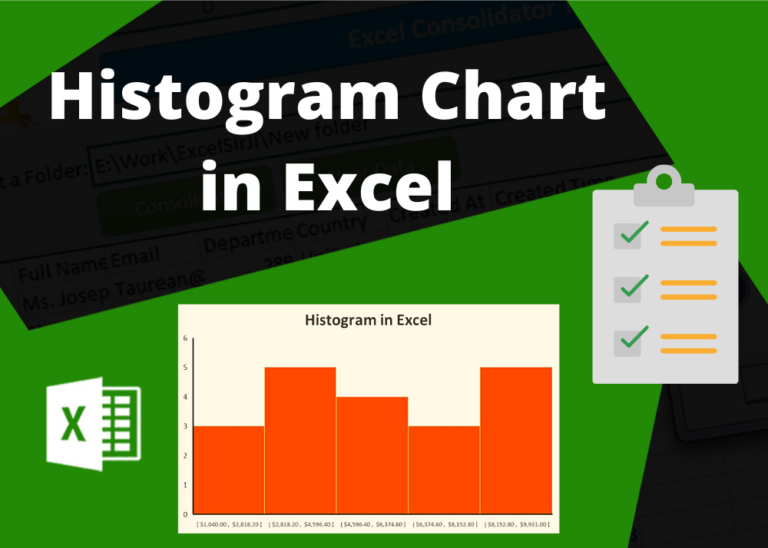
In layman language, this chart divides the data into multiple range groups with same interval i.e. 1-5, 5-10… and then plot the data into these groups to find the distribution among these group. So that you may understand, what are the major areas which has large impact or your major data fall. This helps the user to understand the nature of your data
How to Compare TWO Columns in Excel? Comparing Columns in Microsoft excel is much often feature that is used while managing database. We have many ways to compare the columns in excel and can be…
Understand how to find median in Excel with simple steps. Understanding the middle value in a set of numbers, known as the median, is important in the data industry. Professionals often use Microsoft Excel to calculate this. Excel’s MEDIAN function helps quickly find this value from long lists of numbers. This saves time and allows for further calculations using the median value. In this article, we explain what the MEDIAN function in Excel does, why it’s useful, and two methods to find the median in your data.
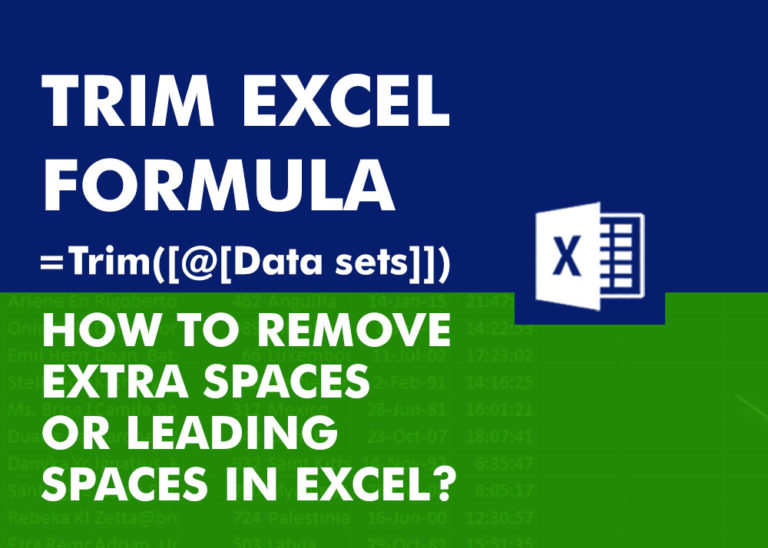
You must have faced a condition when your data cells contain extra spaces, leading spaces or trailing spaces and you wanted to remove these extra spaces to standardize the data. So here you may use…