Histogram was first used by Karl Pearson and It is a tool which helps to understand the data points and its distribution among different groups.
In layman language, this charts divides the data into multiple range groups with same interval i.e. 1-5, 5-10… and then plot the data into these groups to find the distribution among these group. So that you may understand, what are the major areas which has large impact or your major data fall. This helps the user to understand the nature of your data.
Histogram is different from bar chart as bar charts works with two data variables however Histogram works with one data variables (numeric). The intervals/groups used in this graphs are called bins/buckets and this bins are created with same interval or width. These bins are consecutive and non overlapping intervals.
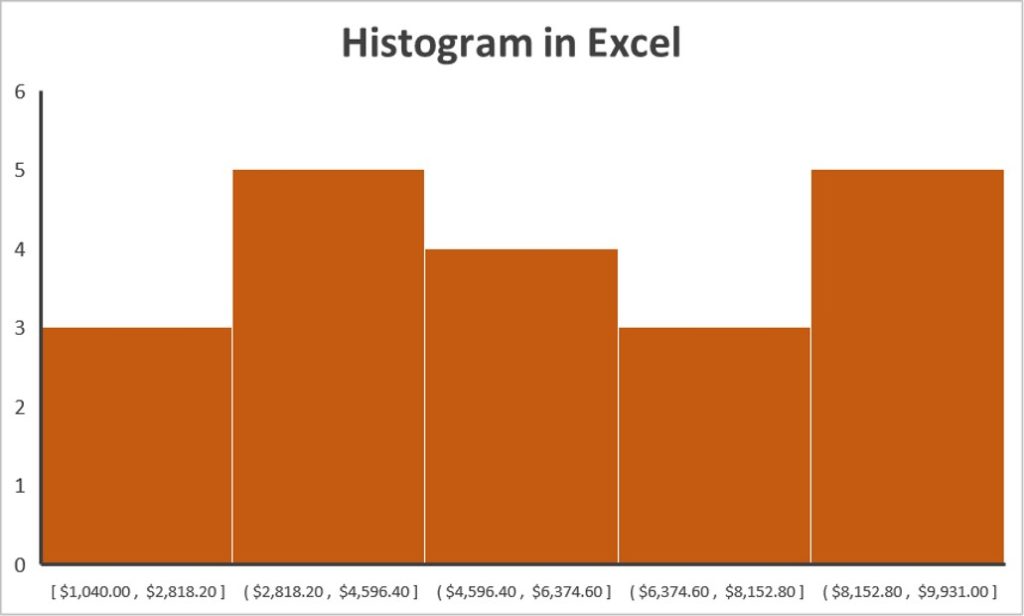
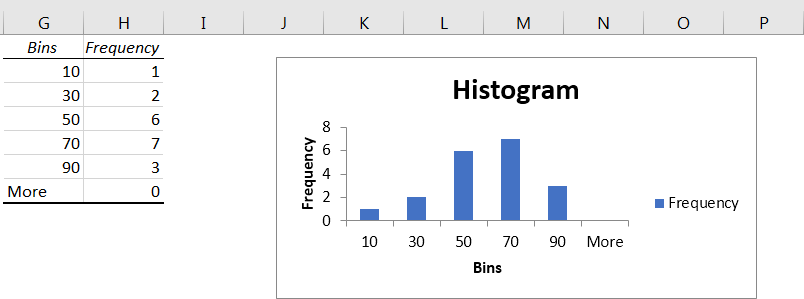
This Histogram will look like as below:
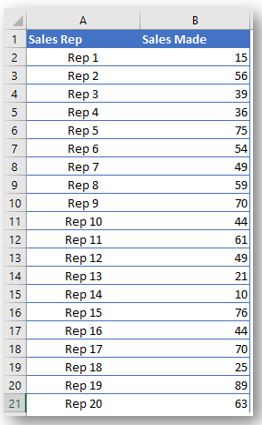
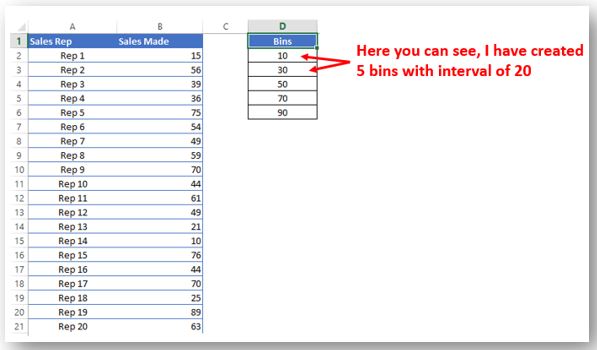
Suppose we have sales number data for sales rep against the target of 100. Now we want to know the common target achieved in different categories
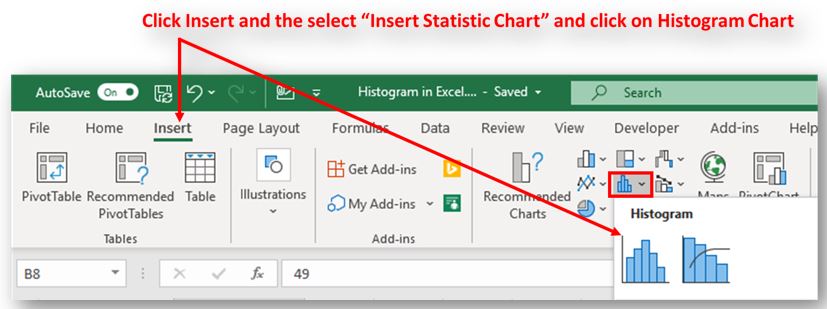
Steps to Create Histogram Chart in Excel 2016 and above versions
– Select your excel Data and Go To Insert Menu on the top Excel Menu
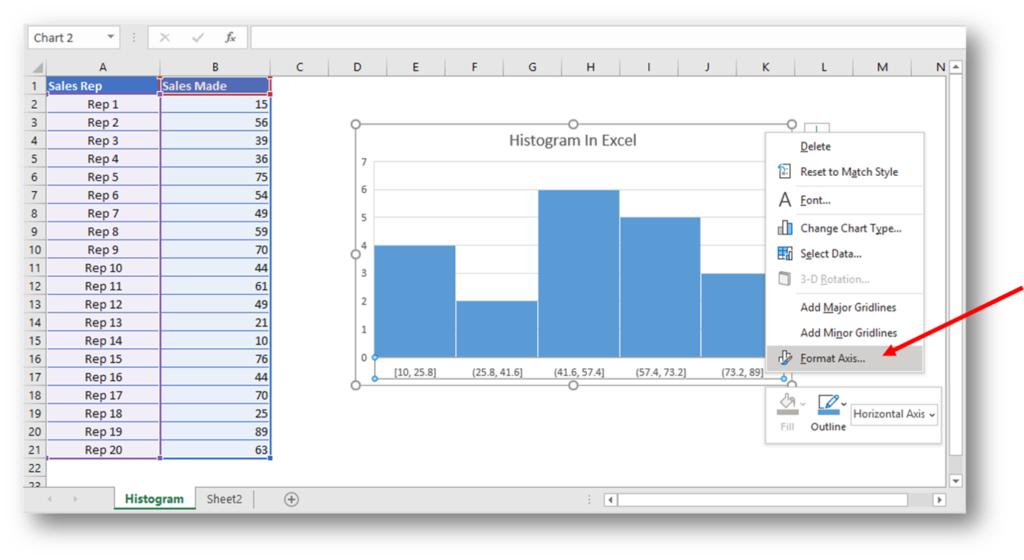
– Once you click on Histogram chart, you will see a chart on your window. Right click on the horizontal Axis (x-Axis) and click format Axis:
– Once you select format Axis, you can change the chart parameters i.e. Bin Width, Bin Numbers, Overflow Bin, Underflow Bin etc
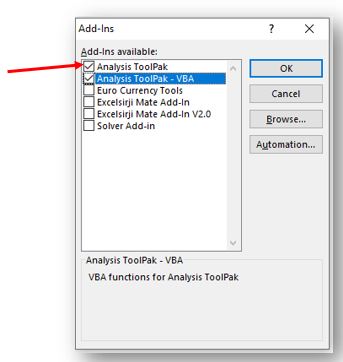
For this we need to install an ADD INN which is available along with MS Office installation “Analysis ToolPAK”. You may learn “How to install Excel ADD INN“ in order to install “Analysis ToolPAK”.
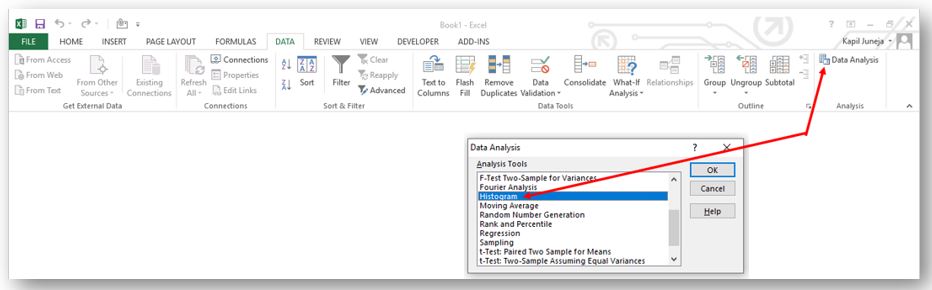
Once you activate the above ADD INN. Then you will be able to see this data analysis option under “Data” menu and click on Data Analysis
Now you select “Histogram” and click Ok. Now you need to create bin starting point with equal intervals. See below:

Few Excel Tips 1. CHANGE DIRECTION WHEN YOU PRESS ENTER Whenever you press enter, you must be thinking why my cell selection shifts down. Why it can’t go UP, Down, Left. Surprised This is very…

Pie Chart is one of the ways of visual presentation of your data sets. Sometimes it makes easier to understand the data while visualizing.
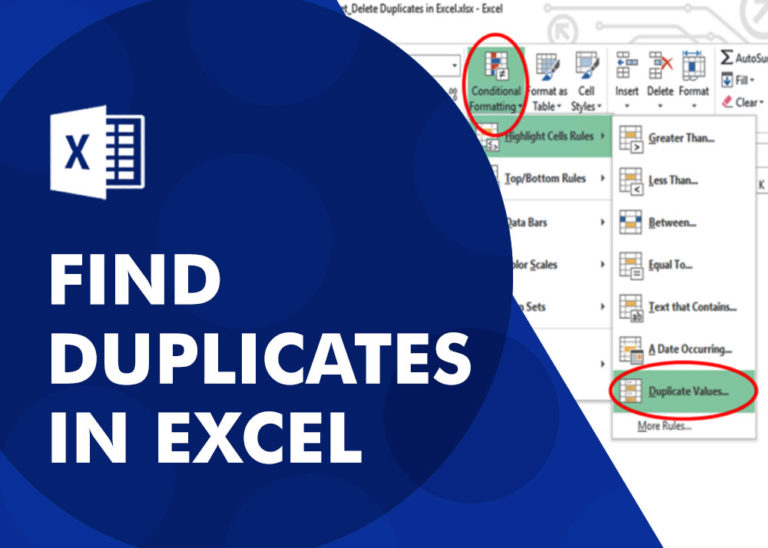
How to find duplicates in excel? Hope you read the post “Remove Duplicates in Excel”. Now I am going to explain how you can find these duplicates. There are multiple methods available to Find and…

Understand how to find median in Excel with simple steps. Understanding the middle value in a set of numbers, known as the median, is important in the data industry. Professionals often use Microsoft Excel to calculate this. Excel’s MEDIAN function helps quickly find this value from long lists of numbers. This saves time and allows for further calculations using the median value. In this article, we explain what the MEDIAN function in Excel does, why it’s useful, and two methods to find the median in your data.
How to protect and share your workbook? Creating beautiful and professional dashboards, projects always lead you to success however there are places when you wanted to protect your dashboards, sheets, cells to prevent users to…
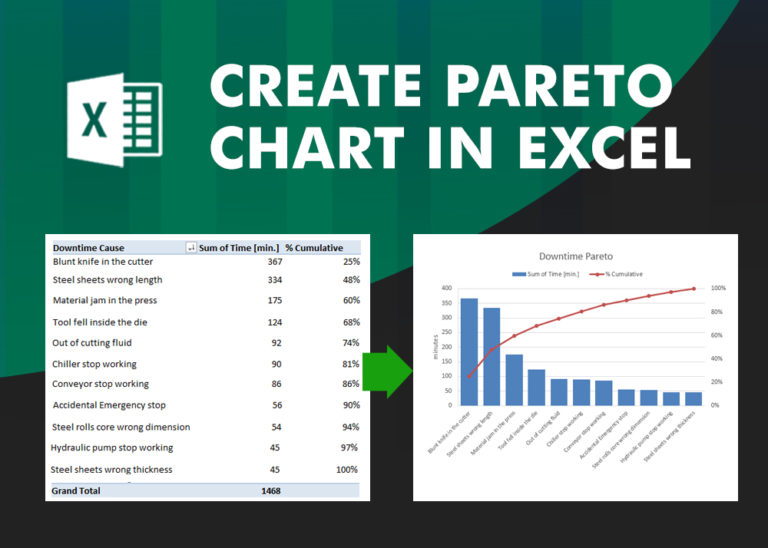
What is Pareto Chart? Pareto principle was introduced by Italian Economist Vilfredo Pareto. He stated that 80% of the effects are caused by 20% of the causes. So if we closely monitor and solve 20% of…