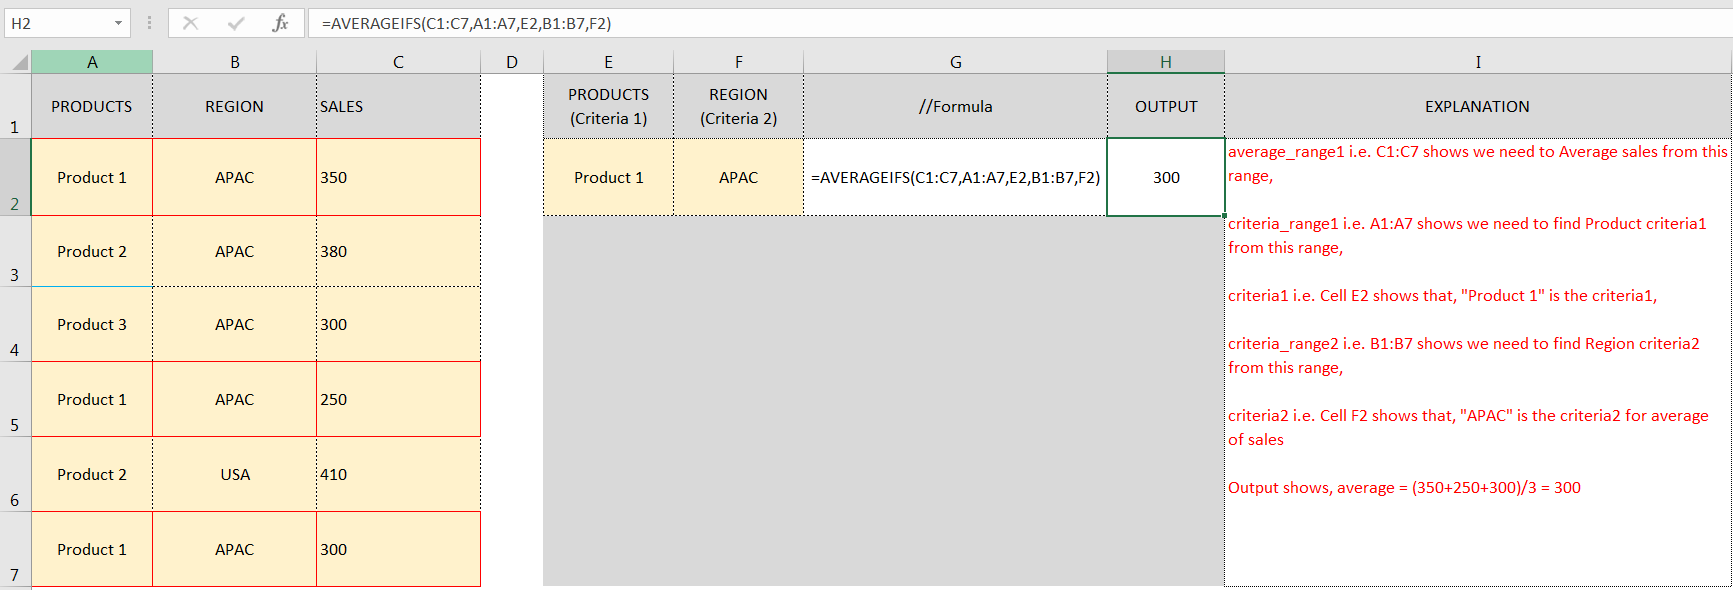
AVERAGEIFS function is used to get the “average” of values for matching criteria across range.
Mathematical Average is calculated following : = Sum of all values / (divided by) number of items
AVERAGEIFS Function has required arguments i.e. average_range, criteria_range1, criteria1 and Optional arguments i.e. [criteria_range2, criteria2]… We can place add more than one range to include multiple criteria or conditions.
=AVERAGEIFS(average_range,criteria_range1,criteria1,[criteria_range2,criteria2]…)
average_range argument is used to give range/ list of values to calculate average as per below criteria
criteria_range1 argument is used to give the range in which criteria1 needs to find
criteria1 argument is used to give criteria for average. We can give value (example “A”, >10, 50) or cell reference number in this argument
[criteria_range2] optional argument is used to give the ANOTHER range in which criteria2 needs to find
[criteria2] optional argument is used to give criteria2 for average. Value or cell reference number can be given.
Kindly note, we can add multiple criteria in the function by separating them with Comma ( , )

Don’t forget to leave your valuable comments!
If you liked this article and want to learn more similar tricks, please Subscribe us.

Microsoft Excel lets you share your spreadsheets with others, but sometimes your co-workers might edit the wrong column by mistake. To avoid this, you can lock specific columns. In this guide, we’ll show you how…

LOWER function is used for changing the format of any text or string to LOWER case.

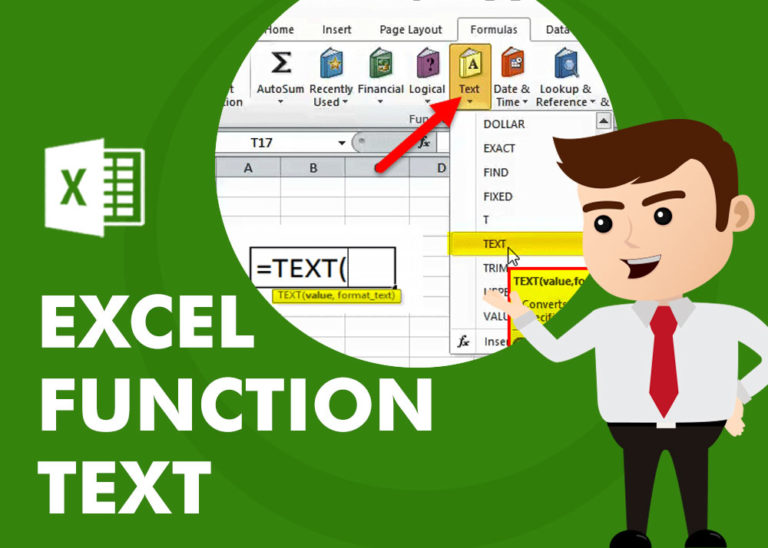
TEXT function is used to change the formatting or appearances of the text. There are various types of formatting available.

Print Row Header on Each Page in Excel means that when you print your worksheet, the selected row (often the top row with column headers) will repeat at the top of every printed page. This ensures…

Conditional Formatting helps to easily identify the usual and unusual numbers/ conditions, creating interactive visualization by means of Highlight Cells by Rules, Top/Bottom Rules, Data Bars, Color Scales and Icon Sets.

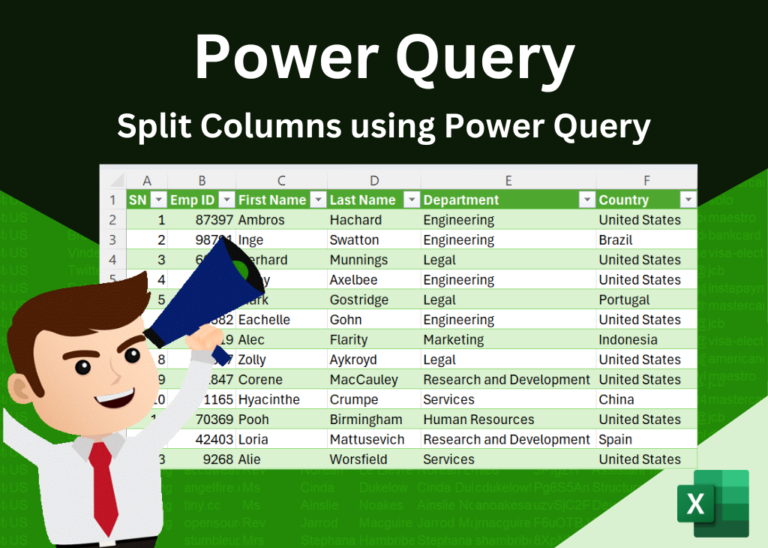
Introduction Welcome to this comprehensive guide on using Power Query in Excel to split data efficiently. In this tutorial, we’ll walk you through the step-by-step process of splitting columns, specifically focusing on splitting the name…