The objective of creating drop-down list is to give an option to a user to select the option from the list.
so that it restricts the user to select unwanted entries input.
we can also use drop-down option for creating interactive dashboards for reporting purpose.
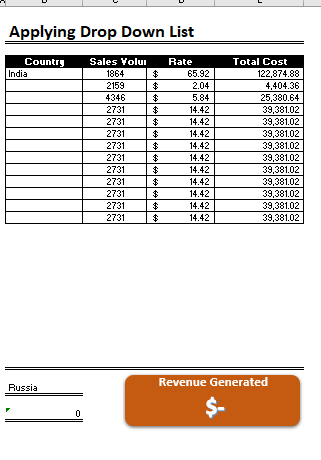
STEP 1 :- As we can see on the top we have a data entry form at the bottom we have a dashboard
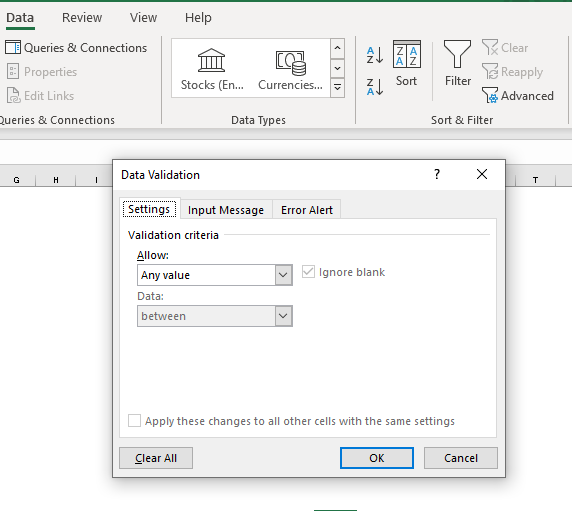
STEP 2 :- So for creating a drop-down list select a cell and go to data under this data there is data validation icon.
now click on the data validation and the screen will pop up shown below.
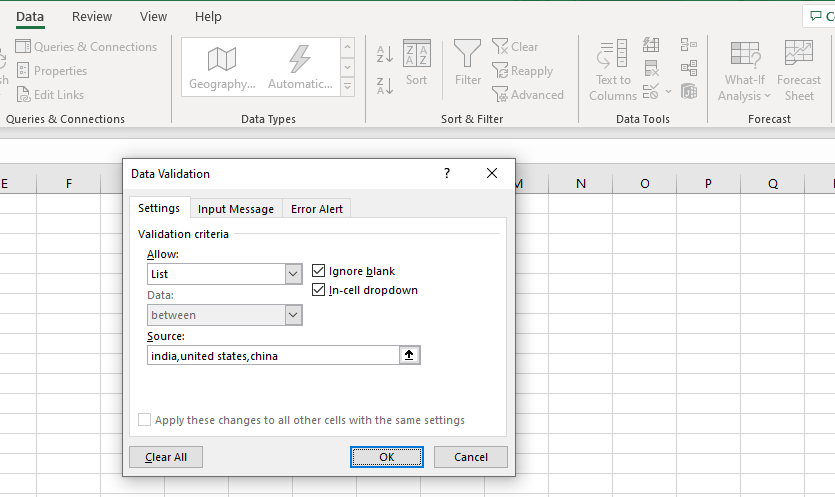
STEP 3 :- Now under the setting option click the allow button and select the list. now in source write the entries for eg india, united states, china etc we can add as many countries than click ok.
STEP 4 :- Now after this, if we select any cell there is a dropdown list of entries like India,united states, china, etc. so our drop-down list is updated.
Now let us understand how to create a drop-down from the list because whenever we have big data sets than it is not easy to write manually every entry. In this case, We will follow the steps given below.
Step 1: Select the cells containing the headings and values
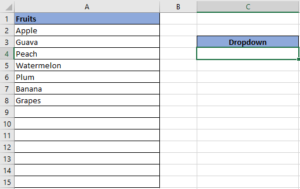
Step 2: Click on “Data” on the top of excel and select Data Validation:

Step 3: Select List under “Allow” and enter the Range of your data under “Source”. Click Ok:
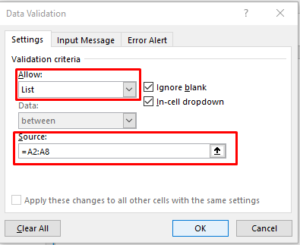
Note: In order to fix the range, you need to use “$” sign before Column and Row reference values i.e. $A$2:$A$8
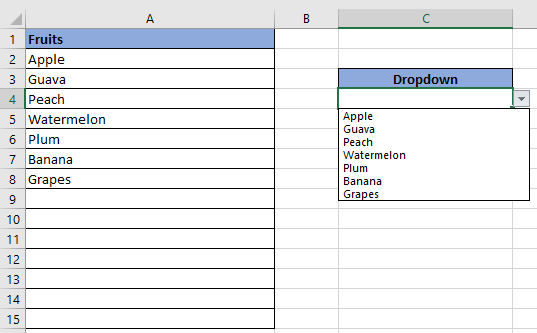
Step 4: Here is your drop down list:

If you have data on paper that you want to add to Excel, you can take a photo of it, save the photo to your computer, and upload the data into Excel. This saves time…

How to protect and share your workbook? Creating beautiful and professional dashboards, projects always lead you to success however there are places when you wanted to protect your dashboards, sheets, cells to prevent users to…

Conditional Formatting helps to easily identify the usual and unusual numbers/ conditions, creating interactive visualization by means of Highlight Cells by Rules, Top/Bottom Rules, Data Bars, Color Scales and Icon Sets.

This step-by-step tutorial empowers you to leverage Power Query’s robust filtering capabilities. Learn to filter by date, text, numbers, and more, streamlining your workflow and unlocking deeper insights from your data. Watch now and elevate your Excel expertise!

Calculate Percentage in Excel Calculate Percentage in Excel :-The term “per cent” comes from the Latin per centum, meaning “by the hundred.” A percentage is a way to show a part of something out of…

In Excel, a line break lets you finish one line of text and begin another within the same cell. It helps create separate lines of information without needing to move to a different cell.