We have got many instances where we needed to generate a random database or values. “RAND function” is very useful for users who creates random database for various types of working and analysis.
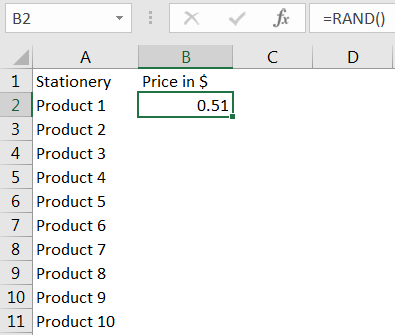
“RAND Function” generates values between 0 to less than 1. We always have output of the “RAND function” in decimals. The formula of function is very simple because it has no arguments and provides the random output.
Syntax: =RAND()
Example: Suppose we need to create a database for the various types of stationery products and their prices for a month.
There is one way to mention the random product prices one by one or we can use the “RAND function” to make the work easy. Here we will go ahead with using function.
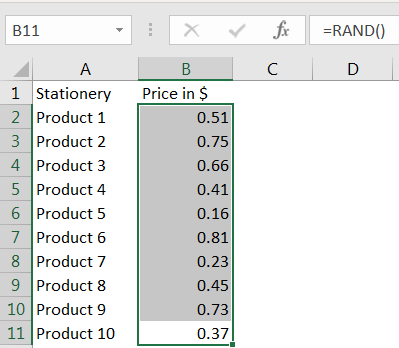
Drag the formula to respective cells. i.e. Select Column + Ctrl + D
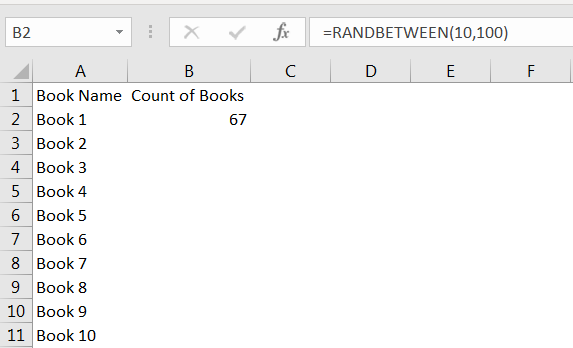
RANDBETWEEN Function is like the function “RAND” that we leant in above topic. RANDBETWEEN function is used where user needs integer values (not decimal) and between a predefined range.
Syntax: RANDBETWEEN(bottom, top)
Here, “bottom” means the lower value and “top” means higher value in range that you want
Example: You want to prepare a random database for volume of books in a books store with minimum quantity of 10 units and maximum quantity of 100 units. So here we need the various book name and random number of books.
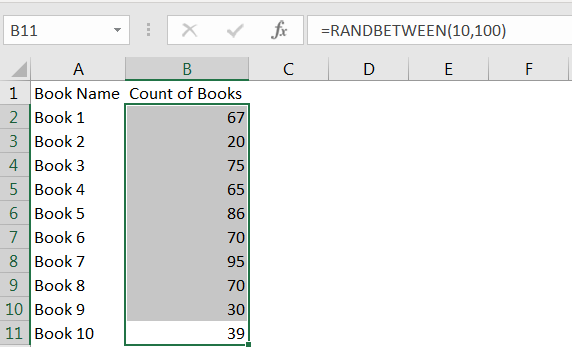
Drag the formula to respective cells. i.e. Select Column + Ctrl + D
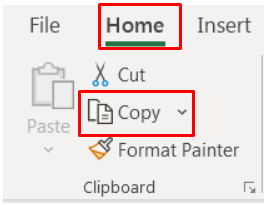
Select the data in column -> Menu- > Home-> Copy
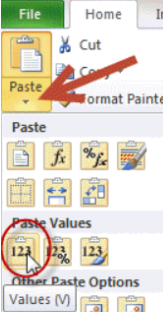
Go to -> Menu- > Home-> Paste Values
Please comment with your questions or feedback related to this article.
Want to learn more similar tricks? Please subscribe to us or follow us.
Keep Learning!!
ROUND function rounds the number value to nearest digit mentioned in argument.
ROUND function has two required arguments i.e. number and num_digits

UPPER function is used for changing the text/string to UPPER case in Microsoft Excel. The output of the function returns value in new cell.

Microsoft Excel “HOUR, MINUTE, SECOND Functions” are time related functions helps to extract the Hour, Minute or Second from a complete Time.
MOD function is used to get the remainder of number that is divided by divisor. MOD Function has two required arguments i.e. number and divisor.
Calculations With Date In Excel Dates function also be used to subtract the Year, Month and Days from the existing dates. Sometimes we need to subtract specific period from the date. In case you are…
SUM Function in Excel Excel is a mathematical spreadsheet where you can perform multiple calculations with the help of Excel Formulas. These are automated formulas which refreshes automatically once you refresh your data in a…